> ## Documentation Index
> Fetch the complete documentation index at: https://docs.allium.so/llms.txt
> Use this file to discover all available pages before exploring further.
# Run a basic query
> Learn how to write and execute SQL queries across all blockchains in the Allium App.
Write SQL queries spanning **all blockchains offered by Allium**. Query raw blockchain data for full flexibility, or leverage abstracted data models to quickly access the data you need (e.g., `crosschain.dex.trades` and `crosschain.stablecoin.transfers`).
Navigate to [app.allium.so/analyze/queries](https://app.allium.so/analyze/queries) and click **New**.
Enter your SQL query in the editor. Here's an example that fetches DEX USD volume for Ethereum, Base, and Solana over the last 10 days:
```sql theme={null}
-- DEX USD volume for Ethereum, Base, and Solana for the last 10 days
select
date(block_timestamp) as date,
chain,
sum(usd_amount) as usd_volume
from crosschain.dex.trades
where
block_timestamp >= current_timestamp - interval '10 days'
and chain in ('ethereum', 'base', 'solana')
group by all
order by date asc;
```
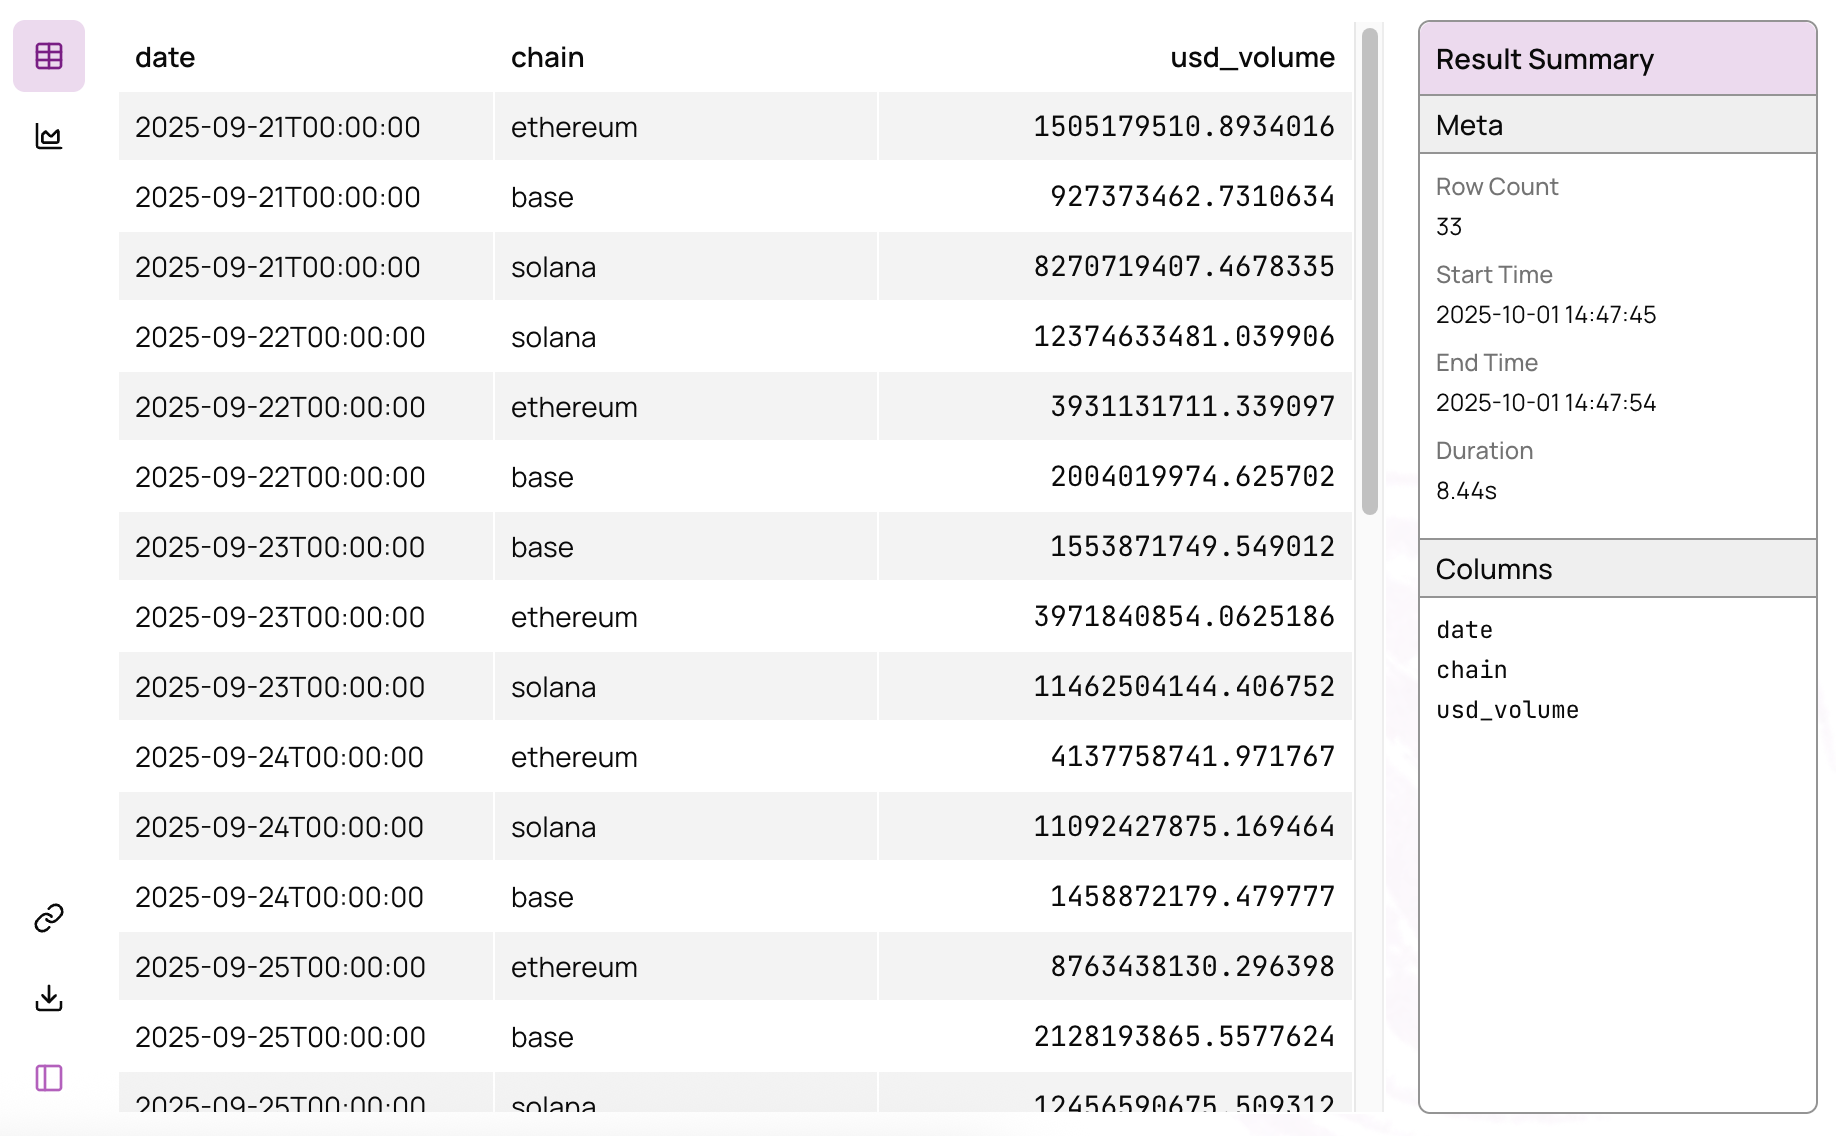
Click **Run** to execute the query. Results appear in table format:
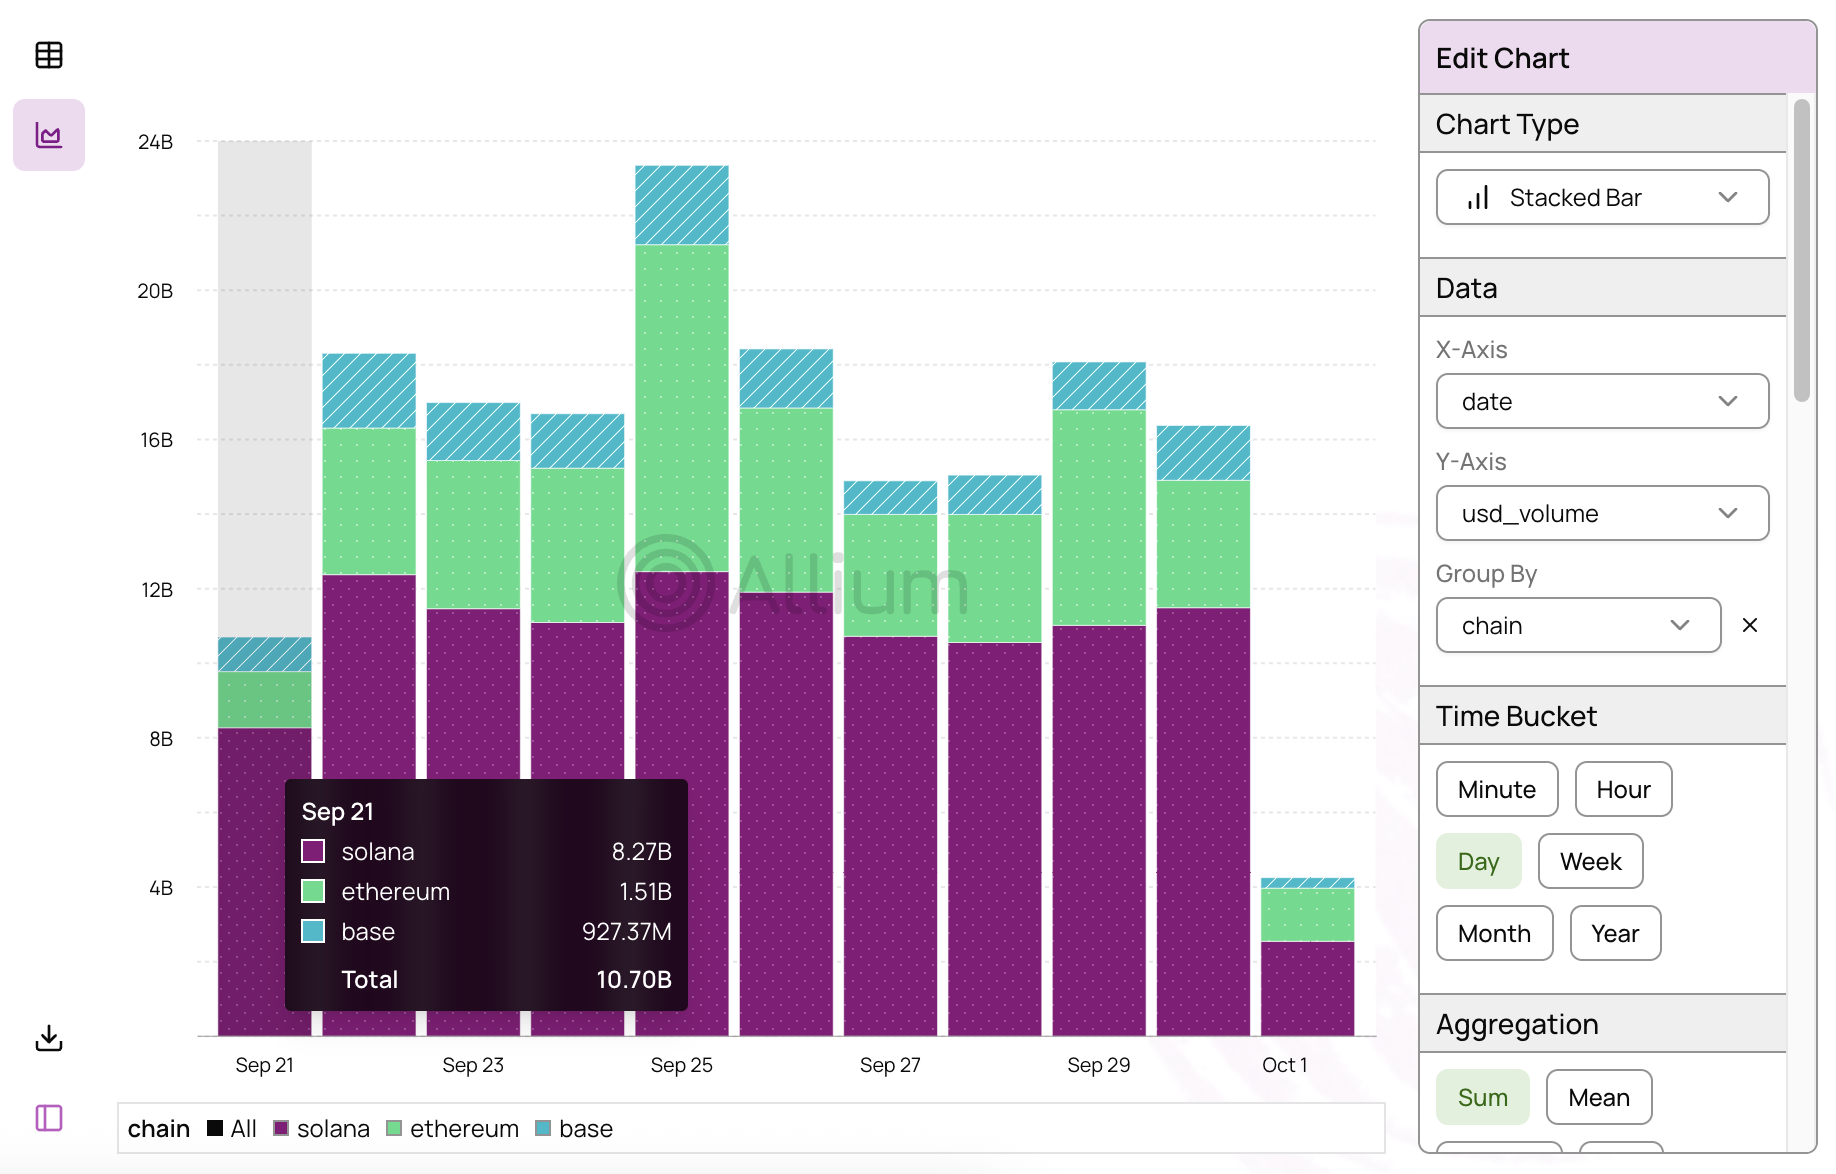
 Switch to chart view and group by chain to visualize the data:
 Learn more about charting options in the [Visualize Results](/app/visualisations) guide.
## Next Steps
Create reusable queries with configurable parameters
Build on top of completed query runs
Execute queries programmatically via REST endpoints
Create charts and visualizations from query results
Learn more about charting options in the [Visualize Results](/app/visualisations) guide.
## Next Steps
Create reusable queries with configurable parameters
Build on top of completed query runs
Execute queries programmatically via REST endpoints
Create charts and visualizations from query results